I recently wrote about my first look at Advanced Predictions in EPM Planning. I kept it simple for the first test. I have now gone back into it and have some additional information to share. I tested some different configurations to get a better understanding of the predicted data. And I wanted to make a comparison of the predicted data with Advanced Predictions (multivariate) vs Auto Predict (univariate).
To keep the univariate and multivariate results separate from each other, I created some scenarios and versions to use specifically for Advanced Predictions. Note: I ended up not needing some of these members, but I did not know for sure when I started.


A form was set up to show the scenario and version combinations for testing.

An Auto Predict job was executed to generate univariate predictions.
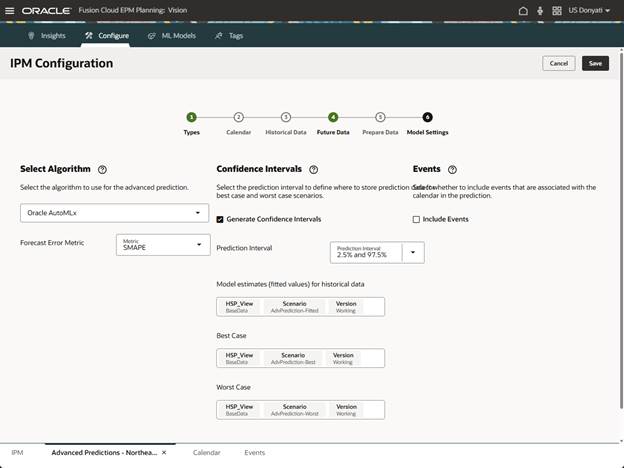
For multivariate, we changed the Define Model Scope in Future Data to use Advanced Predictive Forecast for the scenario. No other changes were made in the Future Data selections, and no changes were made to Historical Data selections.

In Model Settings we enabled Generate Confidence Intervals and left the interval with default settings. This allowed us to select scenarios and versions for Best Case and Worst Case along with the selections for fitted values. The fitted values is still confusing to me, documentation doesn’t define what it is. I believe its purpose is to hold the historical data used for predictions, but I am not positive. Best and Worst were updated with scenarios we created for advanced best and advanced worst, and the version Working was used.
Update 8/22/25 – Oracle provided an explanation as to what fitted values is doing. Fitted value is the trend that gets used with historical data to come up with future data. It is essential for understanding how well the ML model fits the actuals, and explains the accuracy of predictions and whether the ML model is overfitted or underfitted. It should be visible in Explain Predictions. A tutorial is coming out soon from Oracle.
After launching the prediction, you can monitor the status of the job directly from the Configure page. From the ellipses, select Pipeline Status.
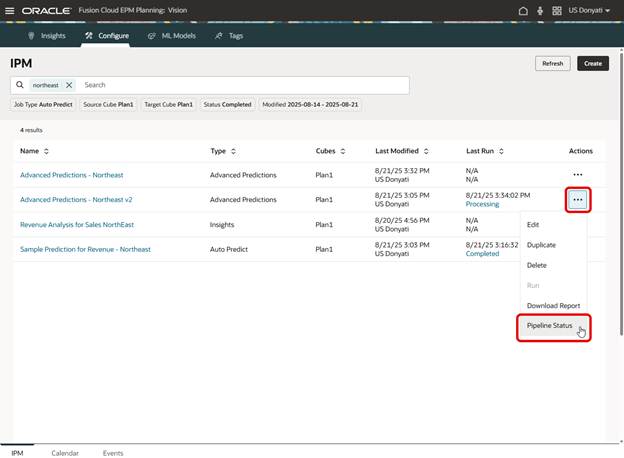
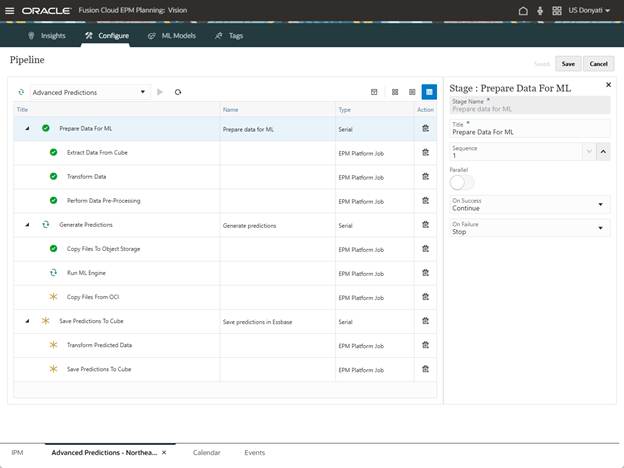
A new tab opens with the Pipeline details.
When the job is completed, Job Details are available by clicking the hyperlink Completed. This is like regular Insights and Auto Predict details.

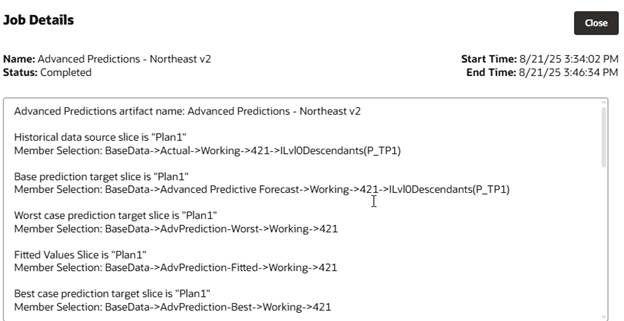
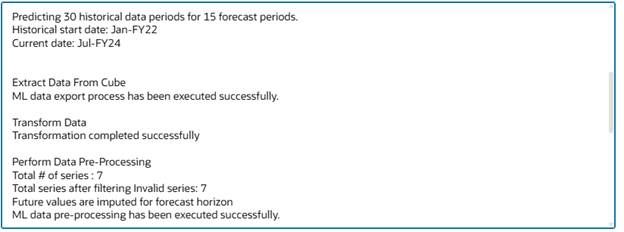

A more detailed log is available to download.

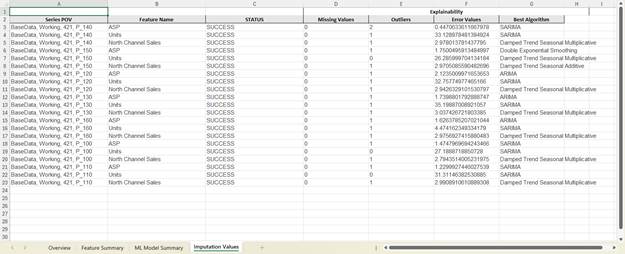
The log includes information on which algorithm was used for each of the data sets. This could be helpful in fine tuning the model when selecting specific algorithms instead of using the Oracle AutoMLx as we did.
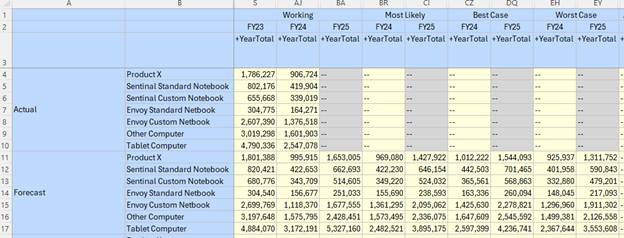
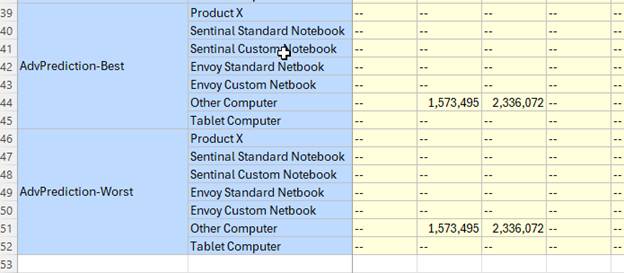
With the job successfully completed, we can now check the results. The predicted forecast looks ok initially; we will dig into the details by month to understand better how it differs from the univariate predictions. But the Best and Worst are not what we expected. The data is correct in the scenarios, but only one product was predicted.

It could be due to the Prediction Interval settings; we had left it with the defaults of 2.5% and 97.5%. Let’s change it and rerun the prediction.

After re-running, there’s no change to the results. I do not know why we are not getting Best and Worst predictions for all the products.
A feature I neglected to show in my first post on Advanced Predictions is Explain Prediction. This is only available on the web. Using the form we created to review the predictions, right click in a cell with predicted data and select Explain Prediction.
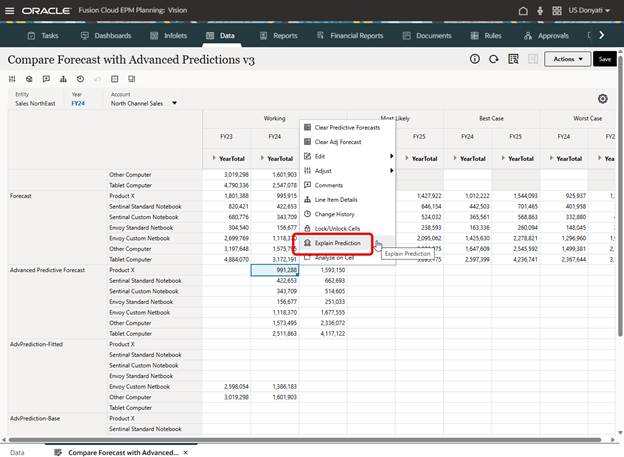
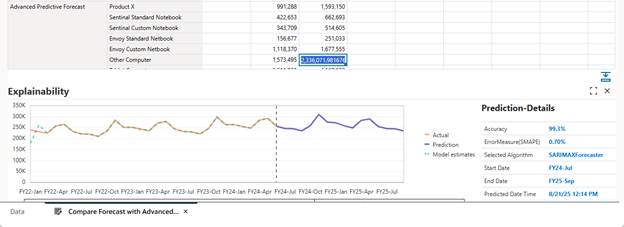
A chart window opens at the bottom of the form with information about the prediction for that cell. The graph shows the actuals history and the prediction, and details related to that data.
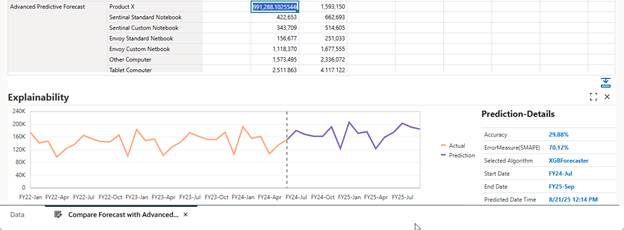
Once the window is open, selecting any other cells with Advanced Prediction data will update the chart and details.
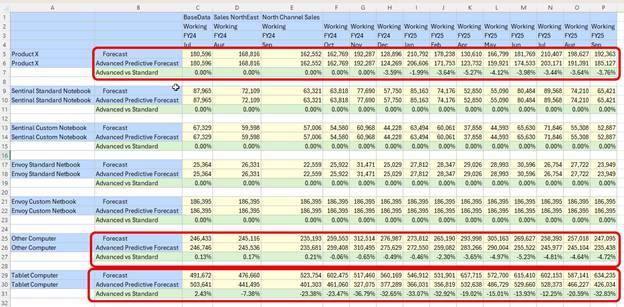
Ok, one last thing to review. We want to compare the results of Advanced Predictions (multivariate) vs Auto Predict (univariate). We set up an ad hoc to make it easier to do the analysis.
The results are interesting. Four of the seven products had no difference in forecast data between Auto Predict and Advanced Predictions. The three products with variances ranged from 0 up to 36%. Keep in mind that the data sample is small, this is not necessarily a useful comparison of methods.
Testing on a larger data set is needed to determine the impact of multivariate vs univariate. But we can see that there is a difference between the two methods. This additional testing was useful, I do have a better understanding of Advanced Predictions now. With that said, there are still some things I need to research further, like why there is no best and worst predicted data for several products and why there is no difference between univariate and multivariate for several products.
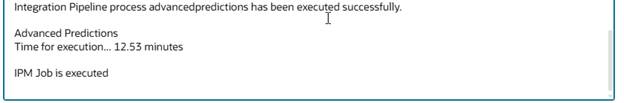
One last comment. This small data set took over 12 minutes to predict using Advanced Predictions and less than 10 seconds using Auto Predict. Depending on how much data is analyzed, be prepared for long processing times.
As always, happy EPM’ng!
