As a follow-up to my post about GenAI in Narrative Reporting, I took some time to create reports for the other use cases. It is basically the same steps with a few differences.
To recap, these are the basic steps.
- Enable the Narrative Reporting environment for Generative AI
- Create a report, add Conditional Text to the report and select type of GenAI use case
Enable the Narrative Reporting Environment for Generative AI
Go into Settings, select Generative AI and click Enable Generative AI.


Create Report
We will create a copy of the original report for testing the “Causality for Exceptions” use case. The grid layout is similar, so we can save some time by using a copy. From the folder with the original report, click the ellipses and select Copy.
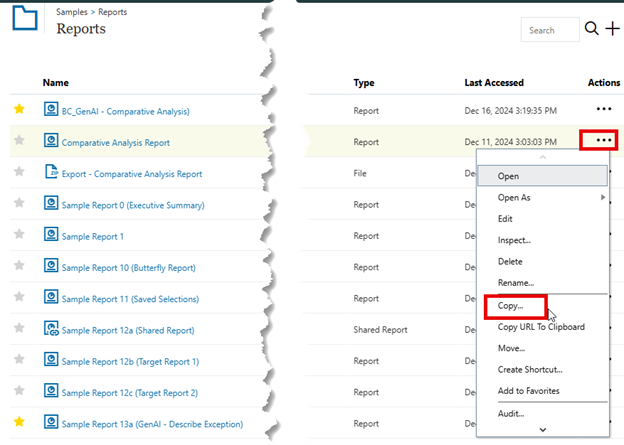
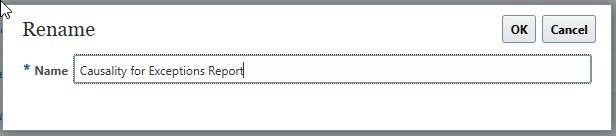
Save to the same folder, click the elipses and select Rename.

Rename and click OK.
Now we can edit the report as needed for this new use case. Open the grid editor and select Dimension Layout.

Move the Entities into the rows and the Accounts to the POV.

Return to grid and select the cells in row one previously enabled with Conditional Formatting and uncheck the Comparative use case.

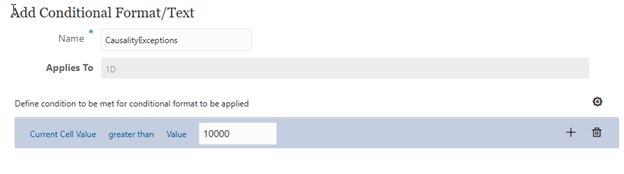
Select cell D,1 and add a new condition.

Define the condition as “Current Cell Value” “greater than” “10000”.
Select Conditional Text and add function (Fx) AutoTextSummary(ZOOM). Note: It is not necessary to Enable Analytics for causality.


Under Conditional Properties, the Analytic Dimension is set to Entities since this is the row dimension in the grid that needs to be analyzed.

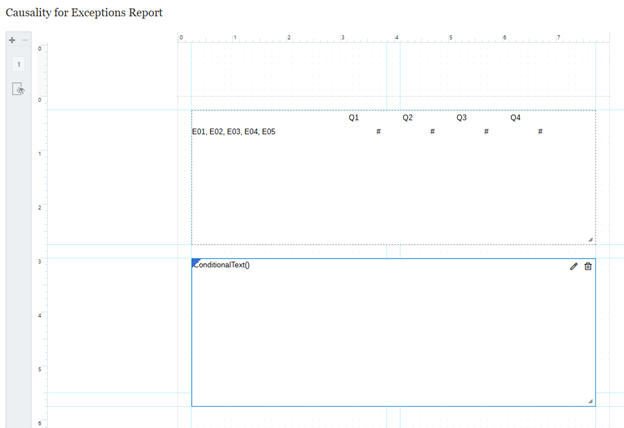
Go back to layout and edit the Text Box.

In the Text Box, edit function (Fx) ConditionalText to remove row reference, it should be ConditionalText().

The layout should look like this.
Save report and run it.

The generated narrative is good. It provides details about what is in the Q4 totals for each of the Entities in the rows. Let’s try something else with this. When we copied the report, we switched Account and Entities in the layout, but we didn’t change which accounts were available for selection. This initially ran with account 310000, what if we select 500000?
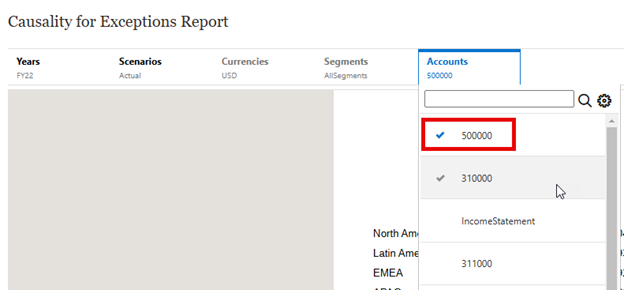
Definitely a different type of narrative. There is nothing to “zoom” into for details.

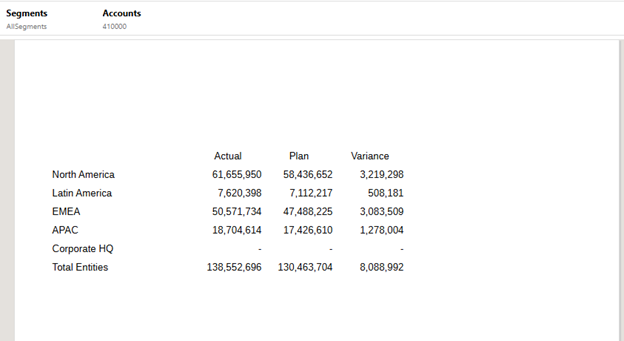
If we change the account to 410000, we get a narrative that has details for the account.

The point I am trying to make with this is that the selection of accounts and entities in the report makes a difference. The narrative will only be as good as the data being analyzed. If the selection of data is limited, the narrative will be less useful. It will likely take some trial and error to determine the right members to analyze.
One more use case to test, “Describe Exceptions”. For this test we need to create a new report since the grid layout will be a bit different. We set up the grid with Scenario in the columns and Entities in the rows. We add a hidden formula column to calculate a percent of total value to be used in the condition definition.

We add a conditional format to cell C1 that checks the value of hidden column D. The Conditional Text is again the AutoTextSummary, but no value is assigned. Also, Enable Analytics is unchecked.

Returning to the layout we add a Text box with function (Fx) ConditionalText().

Save the report and run it.

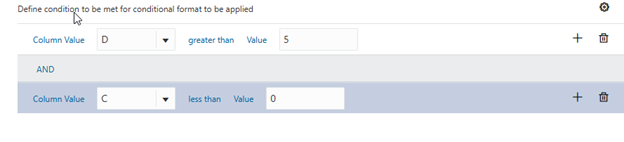
Narrative is generated. It is stating a variance amount for the entities that were greater than 5% variance. This is good, but can be more useful, it is not singling out exceptions. Reviewing the Oracle documentation I see that I omitted another condition. We add this to the Conditional Format.
The new report looks like this.
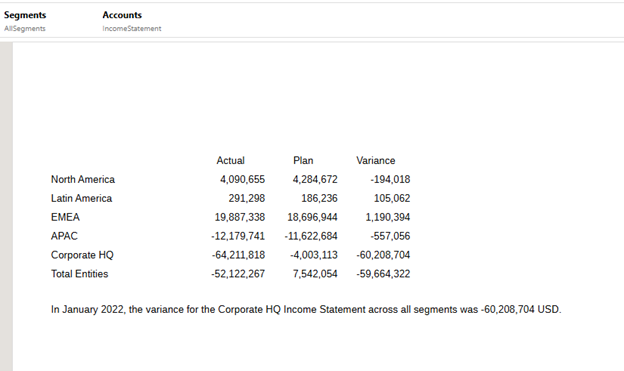
Not good, now there is no narrative. My guess is that the Account selected does not have any variances that trigger the new conditions that were set. Changing Account to “IncomeStatement” does the trick.
As was the case with the “Comparative Analysis” testing, these two use cases were relatively easy to set up and get working. I will need to get a better understanding of how to revise the property files and do some testing with that.
As always, happy EPM’ng!
